How shorted is G50CORP LTD? ASX:G50
#554most shorted Australian stockof 682 companies with disclosed positions, more shorted than 18%
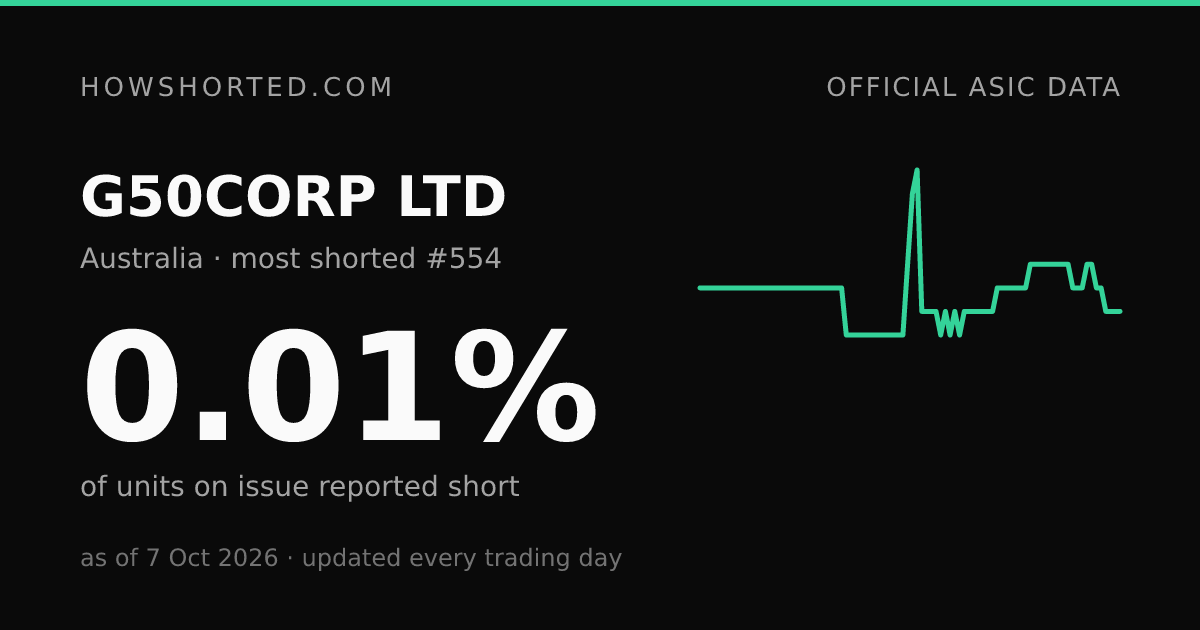
0.01%
of units on issue reported short · trade date 7 Oct 2026
- 5-day change
- −0.01
- 20-day change
- −0.01
- Reported short
- 34,410
- Units on issue
- 249,215,770
Download CSVRSS feedDownload chart cardShare on XRedditLinkedIn
Embed this chart
Paste this snippet to embed the interactive chart. It updates every trading day and keeps the source attribution. Preview
Or a small live badge (Markdown, works in READMEs):
Cite this page
Plain
Wikipedia
BibTeX
History
| Trade date | Short % | Change |
|---|---|---|
| 7 Oct 2026 | 0.01% | 0.00 |
| 6 Oct 2026 | 0.01% | 0.00 |
| 5 Oct 2026 | 0.01% | 0.00 |
| 2 Oct 2026 | 0.01% | −0.01 |
| 1 Oct 2026 | 0.02% | 0.00 |
| 30 Sep 2026 | 0.02% | −0.01 |
| 29 Sep 2026 | 0.03% | 0.00 |
| 28 Sep 2026 | 0.03% | +0.01 |
| 25 Sep 2026 | 0.02% | 0.00 |
| 24 Sep 2026 | 0.02% | 0.00 |
| 23 Sep 2026 | 0.02% | −0.01 |
| 22 Sep 2026 | 0.03% | 0.00 |
| 21 Sep 2026 | 0.03% | 0.00 |
| 18 Sep 2026 | 0.03% | 0.00 |
| 17 Sep 2026 | 0.03% | 0.00 |
| 16 Sep 2026 | 0.03% | 0.00 |
| 15 Sep 2026 | 0.03% | 0.00 |
| 14 Sep 2026 | 0.03% | 0.00 |
| 11 Sep 2026 | 0.03% | 0.00 |
| 10 Sep 2026 | 0.03% | +0.01 |
| 9 Sep 2026 | 0.02% | 0.00 |
| 8 Sep 2026 | 0.02% | 0.00 |
| 7 Sep 2026 | 0.02% | 0.00 |
| 4 Sep 2026 | 0.02% | 0.00 |
| 3 Sep 2026 | 0.02% | 0.00 |
| 2 Sep 2026 | 0.02% | 0.00 |
| 1 Sep 2026 | 0.02% | +0.01 |
| 31 Aug 2026 | 0.01% | 0.00 |
| 28 Aug 2026 | 0.01% | 0.00 |
| 27 Aug 2026 | 0.01% | 0.00 |
| 26 Aug 2026 | 0.01% | 0.00 |
| 25 Aug 2026 | 0.01% | 0.00 |
| 24 Aug 2026 | 0.01% | 0.00 |
| 21 Aug 2026 | 0.01% | +0.01 |
| 20 Aug 2026 | 0.00% | −0.01 |
| 14 Aug 2026 | 0.01% | +0.01 |
| 13 Aug 2026 | 0.00% | −0.01 |
| 12 Aug 2026 | 0.01% | +0.01 |
| 11 Aug 2026 | 0.00% | −0.01 |
| 10 Aug 2026 | 0.01% | 0.00 |
| 7 Aug 2026 | 0.01% | 0.00 |
| 6 Aug 2026 | 0.01% | 0.00 |
| 5 Aug 2026 | 0.01% | −0.06 |
| 4 Aug 2026 | 0.07% | +0.01 |
| 3 Aug 2026 | 0.06% | +0.03 |
| 31 Jul 2026 | 0.03% | +0.03 |
| 30 Jul 2026 | 0.00% | 0.00 |
| 29 Jul 2026 | 0.00% | 0.00 |
| 28 Jul 2026 | 0.00% | 0.00 |
| 27 Jul 2026 | 0.00% | 0.00 |
| 24 Jul 2026 | 0.00% | 0.00 |
| 23 Jul 2026 | 0.00% | 0.00 |
| 22 Jul 2026 | 0.00% | 0.00 |
| 21 Jul 2026 | 0.00% | 0.00 |
| 20 Jul 2026 | 0.00% | 0.00 |
| 17 Jul 2026 | 0.00% | 0.00 |
| 30 Jun 2026 | 0.00% | 0.00 |
| 29 Jun 2026 | 0.00% | 0.00 |
| 26 Jun 2026 | 0.00% | −0.02 |
| 25 Jun 2026 | 0.02% | 0.00 |
| 24 Jun 2026 | 0.02% | 0.00 |
| 23 Jun 2026 | 0.02% | 0.00 |
| 22 Jun 2026 | 0.02% | 0.00 |
| 19 Jun 2026 | 0.02% | 0.00 |
| 18 Jun 2026 | 0.02% | 0.00 |
| 17 Jun 2026 | 0.02% | 0.00 |
| 16 Jun 2026 | 0.02% | 0.00 |
| 15 Jun 2026 | 0.02% | 0.00 |
| 12 Jun 2026 | 0.02% | 0.00 |
| 11 Jun 2026 | 0.02% | 0.00 |
| 10 Jun 2026 | 0.02% | 0.00 |
| 9 Jun 2026 | 0.02% | 0.00 |
| 5 Jun 2026 | 0.02% | 0.00 |
| 4 Jun 2026 | 0.02% | 0.00 |
| 3 Jun 2026 | 0.02% | 0.00 |
| 2 Jun 2026 | 0.02% | 0.00 |
| 1 Jun 2026 | 0.02% | 0.00 |
| 29 May 2026 | 0.02% | 0.00 |
| 28 May 2026 | 0.02% | 0.00 |
| 27 May 2026 | 0.02% | 0.00 |
| 26 May 2026 | 0.02% | 0.00 |
| 25 May 2026 | 0.02% | 0.00 |
| 22 May 2026 | 0.02% | 0.00 |
| 21 May 2026 | 0.02% | 0.00 |
| 20 May 2026 | 0.02% | 0.00 |
| 19 May 2026 | 0.02% | 0.00 |
| 18 May 2026 | 0.02% | 0.00 |
| 15 May 2026 | 0.02% | 0.00 |
| 14 May 2026 | 0.02% | 0.00 |
| 13 May 2026 | 0.02% | 0.00 |
| 12 May 2026 | 0.02% | 0.00 |
| 11 May 2026 | 0.02% | 0.00 |
| 8 May 2026 | 0.02% | 0.00 |
| 7 May 2026 | 0.02% | 0.00 |
| 6 May 2026 | 0.02% | 0.00 |
| 5 May 2026 | 0.02% | 0.00 |
| 4 May 2026 | 0.02% | 0.00 |
| 1 May 2026 | 0.02% | 0.00 |
| 30 Apr 2026 | 0.02% | 0.00 |
| 29 Apr 2026 | 0.02% | 0.00 |
| 28 Apr 2026 | 0.02% | 0.00 |
| 27 Apr 2026 | 0.02% | 0.00 |
| 24 Apr 2026 | 0.02% | 0.00 |
| 23 Apr 2026 | 0.02% | +0.02 |
| 22 Apr 2026 | 0.00% | 0.00 |
| 21 Apr 2026 | 0.00% | 0.00 |
| 20 Apr 2026 | 0.00% | 0.00 |
| 17 Apr 2026 | 0.00% | 0.00 |
| 16 Apr 2026 | 0.00% | −0.01 |
| 15 Apr 2026 | 0.01% | 0.00 |
| 14 Apr 2026 | 0.01% | 0.00 |
| 13 Apr 2026 | 0.01% | 0.00 |
| 10 Apr 2026 | 0.01% | 0.00 |
| 9 Apr 2026 | 0.01% | 0.00 |
| 8 Apr 2026 | 0.01% | +0.01 |
| 7 Apr 2026 | 0.00% | −0.01 |
| 2 Apr 2026 | 0.01% | 0.00 |
| 1 Apr 2026 | 0.01% | +0.01 |
| 31 Mar 2026 | 0.00% | 0.00 |
| 30 Mar 2026 | 0.00% | 0.00 |
| 16 Mar 2026 | 0.00% | 0.00 |
| 13 Mar 2026 | 0.00% | 0.00 |
| 12 Mar 2026 | 0.00% | 0.00 |
| 11 Mar 2026 | 0.00% | 0.00 |
| 10 Mar 2026 | 0.00% | −0.01 |
| 9 Mar 2026 | 0.01% | 0.00 |
| 6 Mar 2026 | 0.01% | +0.01 |
| 5 Mar 2026 | 0.00% | 0.00 |
| 4 Mar 2026 | 0.00% | 0.00 |
| 3 Mar 2026 | 0.00% | 0.00 |
| 2 Mar 2026 | 0.00% | 0.00 |
| 27 Feb 2026 | 0.00% | 0.00 |
| 26 Feb 2026 | 0.00% | 0.00 |
| 25 Feb 2026 | 0.00% | 0.00 |
| 24 Feb 2026 | 0.00% | −0.01 |
| 23 Feb 2026 | 0.01% | 0.00 |
| 20 Feb 2026 | 0.01% | 0.00 |
| 19 Feb 2026 | 0.01% | 0.00 |
| 18 Feb 2026 | 0.01% | 0.00 |
| 17 Feb 2026 | 0.01% | 0.00 |
| 16 Feb 2026 | 0.01% | 0.00 |
| 13 Feb 2026 | 0.01% | 0.00 |
| 12 Feb 2026 | 0.01% | 0.00 |
| 11 Feb 2026 | 0.01% | 0.00 |
| 10 Feb 2026 | 0.01% | 0.00 |
| 9 Feb 2026 | 0.01% | 0.00 |
| 6 Feb 2026 | 0.01% | 0.00 |
| 5 Feb 2026 | 0.01% | 0.00 |
| 4 Feb 2026 | 0.01% | 0.00 |
| 3 Feb 2026 | 0.01% | 0.00 |
| 2 Feb 2026 | 0.01% | 0.00 |
| 30 Jan 2026 | 0.01% | 0.00 |
| 29 Jan 2026 | 0.01% | −0.01 |
| 28 Jan 2026 | 0.02% | 0.00 |
| 27 Jan 2026 | 0.02% | 0.00 |
| 23 Jan 2026 | 0.02% | 0.00 |
| 22 Jan 2026 | 0.02% | 0.00 |
| 21 Jan 2026 | 0.02% | 0.00 |
| 20 Jan 2026 | 0.02% | 0.00 |
| 19 Jan 2026 | 0.02% | −0.01 |
| 16 Jan 2026 | 0.03% | 0.00 |
| 15 Jan 2026 | 0.03% | 0.00 |
| 14 Jan 2026 | 0.03% | +0.01 |
| 13 Jan 2026 | 0.02% | −0.01 |
| 12 Jan 2026 | 0.03% | +0.01 |
| 9 Jan 2026 | 0.02% | +0.01 |
| 8 Jan 2026 | 0.01% | 0.00 |
| 7 Jan 2026 | 0.01% | 0.00 |
| 6 Jan 2026 | 0.01% | 0.00 |
| 5 Jan 2026 | 0.01% | 0.00 |
| 2 Jan 2026 | 0.01% | +0.01 |
| 31 Dec 2025 | 0.00% | 0.00 |
| 30 Dec 2025 | 0.00% | 0.00 |
| 29 Dec 2025 | 0.00% | −0.01 |
| 24 Dec 2025 | 0.01% | 0.00 |
| 23 Dec 2025 | 0.01% | 0.00 |
| 22 Dec 2025 | 0.01% | 0.00 |
| 19 Dec 2025 | 0.01% | −0.01 |
| 18 Dec 2025 | 0.02% | 0.00 |
| 17 Dec 2025 | 0.02% | 0.00 |
| 16 Dec 2025 | 0.02% | 0.00 |
| 15 Dec 2025 | 0.02% | 0.00 |
| 12 Dec 2025 | 0.02% | 0.00 |
| 11 Dec 2025 | 0.02% | 0.00 |
| 10 Dec 2025 | 0.02% | 0.00 |
| 9 Dec 2025 | 0.02% | 0.00 |
| 8 Dec 2025 | 0.02% | 0.00 |
| 5 Dec 2025 | 0.02% | 0.00 |
| 4 Dec 2025 | 0.02% | +0.01 |
| 3 Dec 2025 | 0.01% | 0.00 |
| 2 Dec 2025 | 0.01% | 0.00 |
| 1 Dec 2025 | 0.01% | 0.00 |
| 28 Nov 2025 | 0.01% | −0.01 |
| 27 Nov 2025 | 0.02% | 0.00 |
| 26 Nov 2025 | 0.02% | +0.01 |
| 25 Nov 2025 | 0.01% | −0.02 |
| 21 Nov 2025 | 0.03% | +0.01 |
| 20 Nov 2025 | 0.02% | 0.00 |
| 19 Nov 2025 | 0.02% | 0.00 |
| 18 Nov 2025 | 0.02% | +0.01 |
| 17 Nov 2025 | 0.01% | 0.00 |
| 14 Nov 2025 | 0.01% | +0.01 |
| 13 Nov 2025 | 0.00% | 0.00 |
| 12 Nov 2025 | 0.00% | −0.02 |
| 11 Nov 2025 | 0.02% | +0.01 |
| 10 Nov 2025 | 0.01% | 0.00 |
| 7 Nov 2025 | 0.01% | 0.00 |
| 6 Nov 2025 | 0.01% | 0.00 |
| 10 Oct 2025 | 0.01% | +0.01 |
| 1 Oct 2025 | 0.00% | −0.11 |
| 28 Aug 2025 | 0.11% | −0.01 |
| 27 Aug 2025 | 0.12% | −0.13 |
| 26 Nov 2024 | 0.25% | 0.00 |
| 25 Nov 2024 | 0.25% | +0.25 |
| 16 Oct 2023 | 0.00% | 0.00 |
| 5 Sep 2023 | 0.00% | – |
Newest first. Scroll inside the table for earlier dates, back to 5 Sep 2023.
About this data
- ASX code
- G50
- First seen in dataset
- 5 Sep 2023
- Listing
- G50CORP LTD on the ASX ↗
Short position data © Australian Securities & Investments Commission. Reproduced with permission (CC BY 4.0). We show regulatory short-position data only: no prices, no valuations, no recommendations.
Frequently asked questions
- How shorted is G50CORP LTD right now?
- 0.01% of G50CORP LTD's units on issue were reported as short positions for trade date 7 Oct 2026, per ASIC's daily aggregated short position report. That is 34,410 units reported short of 249,215,770 on issue.
- Is G50CORP LTD one of the most shorted ASX stocks?
- It ranks 554th of 682 ASX products by reported short position, at 0.01% of shares on issue. The full most shorted ASX stocks table is updated every trading day from ASIC's report.
- What does this number include?
- ASIC aggregates the short positions that all short sellers report to it daily (reporting starts at A$100,000 or 0.01% of capital), expressed as a percentage of total product in issue. It is close to a complete picture of open short positions in the product.
- Why is the latest figure four days old?
- ASIC publishes each trade date's aggregate on the fourth business day afterwards (T+4). We ingest each file the day it appears.
- Which funds are short?
- Australia's public data is aggregate-only: individual short sellers are not named in ASIC's daily report.