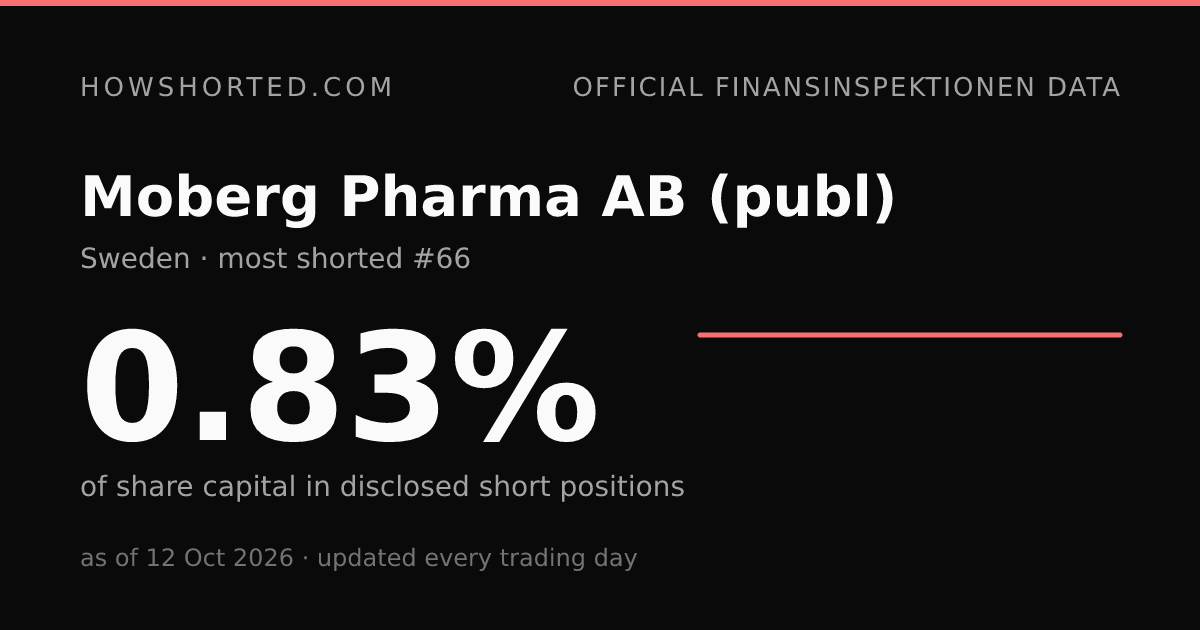
How shorted is Moberg Pharma AB (publ)? SE0003613090
#66most shorted Swedish stockof 101 companies with disclosed positions, more shorted than 34%
0.83%
of share capital in disclosed short positions · 12 Oct 2026
- 5-day change
- 0.00
- 20-day change
- 0.00
Download CSVRSS feedDownload chart cardShare on XRedditLinkedIn
Embed this chart
Paste this snippet to embed the interactive chart. It updates every trading day and keeps the source attribution. Preview
Or a small live badge (Markdown, works in READMEs):
Cite this page
Plain
Wikipedia
BibTeX
Who is short Moberg Pharma AB (publ)?
| Position holder | Position | Since |
|---|---|---|
| CITADEL ADVISORS II LLC | 0.83% | 19 Dec 2019 |
Named positions of 0.5%+ as published by the Finansinspektionen. The dates shown are each holder's latest disclosure date.
Sector: Healthcare
History
| Position date | Short % | Change |
|---|---|---|
| 12 Oct 2026 | 0.83% | 0.00 |
| 9 Oct 2026 | 0.83% | 0.00 |
| 8 Oct 2026 | 0.83% | 0.00 |
| 7 Oct 2026 | 0.83% | 0.00 |
| 6 Oct 2026 | 0.83% | 0.00 |
| 5 Oct 2026 | 0.83% | 0.00 |
| 2 Oct 2026 | 0.83% | 0.00 |
| 1 Oct 2026 | 0.83% | 0.00 |
| 30 Sep 2026 | 0.83% | 0.00 |
| 29 Sep 2026 | 0.83% | 0.00 |
| 28 Sep 2026 | 0.83% | 0.00 |
| 25 Sep 2026 | 0.83% | 0.00 |
| 24 Sep 2026 | 0.83% | 0.00 |
| 23 Sep 2026 | 0.83% | 0.00 |
| 22 Sep 2026 | 0.83% | 0.00 |
| 21 Sep 2026 | 0.83% | 0.00 |
| 18 Sep 2026 | 0.83% | 0.00 |
| 17 Sep 2026 | 0.83% | 0.00 |
| 16 Sep 2026 | 0.83% | 0.00 |
| 15 Sep 2026 | 0.83% | 0.00 |
| 14 Sep 2026 | 0.83% | 0.00 |
| 11 Sep 2026 | 0.83% | 0.00 |
| 10 Sep 2026 | 0.83% | 0.00 |
| 9 Sep 2026 | 0.83% | 0.00 |
| 8 Sep 2026 | 0.83% | 0.00 |
| 7 Sep 2026 | 0.83% | 0.00 |
| 4 Sep 2026 | 0.83% | 0.00 |
| 3 Sep 2026 | 0.83% | 0.00 |
| 2 Sep 2026 | 0.83% | 0.00 |
| 1 Sep 2026 | 0.83% | 0.00 |
| 31 Aug 2026 | 0.83% | 0.00 |
| 28 Aug 2026 | 0.83% | 0.00 |
| 27 Aug 2026 | 0.83% | 0.00 |
| 26 Aug 2026 | 0.83% | 0.00 |
| 25 Aug 2026 | 0.83% | 0.00 |
| 24 Aug 2026 | 0.83% | 0.00 |
| 21 Aug 2026 | 0.83% | 0.00 |
| 20 Aug 2026 | 0.83% | 0.00 |
| 19 Aug 2026 | 0.83% | 0.00 |
| 18 Aug 2026 | 0.83% | 0.00 |
| 17 Aug 2026 | 0.83% | 0.00 |
| 14 Aug 2026 | 0.83% | 0.00 |
| 13 Aug 2026 | 0.83% | 0.00 |
| 12 Aug 2026 | 0.83% | 0.00 |
| 11 Aug 2026 | 0.83% | 0.00 |
| 10 Aug 2026 | 0.83% | 0.00 |
| 7 Aug 2026 | 0.83% | 0.00 |
| 6 Aug 2026 | 0.83% | 0.00 |
| 5 Aug 2026 | 0.83% | 0.00 |
| 4 Aug 2026 | 0.83% | 0.00 |
| 3 Aug 2026 | 0.83% | 0.00 |
| 31 Jul 2026 | 0.83% | 0.00 |
| 30 Jul 2026 | 0.83% | 0.00 |
| 29 Jul 2026 | 0.83% | 0.00 |
| 28 Jul 2026 | 0.83% | 0.00 |
| 27 Jul 2026 | 0.83% | 0.00 |
| 24 Jul 2026 | 0.83% | 0.00 |
| 23 Jul 2026 | 0.83% | 0.00 |
| 22 Jul 2026 | 0.83% | 0.00 |
| 21 Jul 2026 | 0.83% | 0.00 |
| 20 Jul 2026 | 0.83% | 0.00 |
| 17 Jul 2026 | 0.83% | 0.00 |
| 16 Jul 2026 | 0.83% | 0.00 |
| 15 Jul 2026 | 0.83% | 0.00 |
| 14 Jul 2026 | 0.83% | 0.00 |
| 13 Jul 2026 | 0.83% | 0.00 |
| 10 Jul 2026 | 0.83% | 0.00 |
| 9 Jul 2026 | 0.83% | 0.00 |
| 8 Jul 2026 | 0.83% | 0.00 |
| 7 Jul 2026 | 0.83% | 0.00 |
| 6 Jul 2026 | 0.83% | 0.00 |
| 3 Jul 2026 | 0.83% | 0.00 |
| 2 Jul 2026 | 0.83% | 0.00 |
| 1 Jul 2026 | 0.83% | 0.00 |
| 30 Jun 2026 | 0.83% | 0.00 |
| 29 Jun 2026 | 0.83% | 0.00 |
| 26 Jun 2026 | 0.83% | 0.00 |
| 25 Jun 2026 | 0.83% | 0.00 |
| 24 Jun 2026 | 0.83% | 0.00 |
| 23 Jun 2026 | 0.83% | 0.00 |
| 22 Jun 2026 | 0.83% | 0.00 |
| 19 Jun 2026 | 0.83% | 0.00 |
| 18 Jun 2026 | 0.83% | 0.00 |
| 17 Jun 2026 | 0.83% | 0.00 |
| 16 Jun 2026 | 0.83% | 0.00 |
| 15 Jun 2026 | 0.83% | 0.00 |
| 12 Jun 2026 | 0.83% | 0.00 |
| 11 Jun 2026 | 0.83% | 0.00 |
| 10 Jun 2026 | 0.83% | 0.00 |
| 9 Jun 2026 | 0.83% | 0.00 |
| 8 Jun 2026 | 0.83% | 0.00 |
| 5 Jun 2026 | 0.83% | 0.00 |
| 4 Jun 2026 | 0.83% | 0.00 |
| 3 Jun 2026 | 0.83% | 0.00 |
| 2 Jun 2026 | 0.83% | 0.00 |
| 1 Jun 2026 | 0.83% | 0.00 |
| 29 May 2026 | 0.83% | 0.00 |
| 28 May 2026 | 0.83% | 0.00 |
| 27 May 2026 | 0.83% | 0.00 |
| 26 May 2026 | 0.83% | 0.00 |
| 25 May 2026 | 0.83% | 0.00 |
| 22 May 2026 | 0.83% | 0.00 |
| 21 May 2026 | 0.83% | 0.00 |
| 20 May 2026 | 0.83% | 0.00 |
| 19 May 2026 | 0.83% | 0.00 |
| 18 May 2026 | 0.83% | 0.00 |
| 15 May 2026 | 0.83% | 0.00 |
| 14 May 2026 | 0.83% | 0.00 |
| 13 May 2026 | 0.83% | 0.00 |
| 12 May 2026 | 0.83% | 0.00 |
| 11 May 2026 | 0.83% | 0.00 |
| 8 May 2026 | 0.83% | 0.00 |
| 7 May 2026 | 0.83% | 0.00 |
| 6 May 2026 | 0.83% | 0.00 |
| 5 May 2026 | 0.83% | 0.00 |
| 4 May 2026 | 0.83% | 0.00 |
| 1 May 2026 | 0.83% | 0.00 |
| 30 Apr 2026 | 0.83% | 0.00 |
| 29 Apr 2026 | 0.83% | 0.00 |
| 28 Apr 2026 | 0.83% | 0.00 |
| 27 Apr 2026 | 0.83% | 0.00 |
| 24 Apr 2026 | 0.83% | 0.00 |
| 23 Apr 2026 | 0.83% | 0.00 |
| 22 Apr 2026 | 0.83% | 0.00 |
| 21 Apr 2026 | 0.83% | 0.00 |
| 20 Apr 2026 | 0.83% | 0.00 |
| 17 Apr 2026 | 0.83% | 0.00 |
| 16 Apr 2026 | 0.83% | 0.00 |
| 15 Apr 2026 | 0.83% | 0.00 |
| 14 Apr 2026 | 0.83% | 0.00 |
| 13 Apr 2026 | 0.83% | 0.00 |
| 10 Apr 2026 | 0.83% | 0.00 |
| 9 Apr 2026 | 0.83% | 0.00 |
| 8 Apr 2026 | 0.83% | 0.00 |
| 7 Apr 2026 | 0.83% | 0.00 |
| 6 Apr 2026 | 0.83% | 0.00 |
| 3 Apr 2026 | 0.83% | 0.00 |
| 2 Apr 2026 | 0.83% | 0.00 |
| 1 Apr 2026 | 0.83% | 0.00 |
| 31 Mar 2026 | 0.83% | 0.00 |
| 30 Mar 2026 | 0.83% | 0.00 |
| 27 Mar 2026 | 0.83% | 0.00 |
| 26 Mar 2026 | 0.83% | 0.00 |
| 25 Mar 2026 | 0.83% | 0.00 |
| 24 Mar 2026 | 0.83% | 0.00 |
| 23 Mar 2026 | 0.83% | 0.00 |
| 20 Mar 2026 | 0.83% | 0.00 |
| 19 Mar 2026 | 0.83% | 0.00 |
| 18 Mar 2026 | 0.83% | 0.00 |
| 17 Mar 2026 | 0.83% | 0.00 |
| 16 Mar 2026 | 0.83% | 0.00 |
| 13 Mar 2026 | 0.83% | 0.00 |
| 12 Mar 2026 | 0.83% | 0.00 |
| 11 Mar 2026 | 0.83% | 0.00 |
| 10 Mar 2026 | 0.83% | 0.00 |
| 9 Mar 2026 | 0.83% | 0.00 |
| 6 Mar 2026 | 0.83% | 0.00 |
| 5 Mar 2026 | 0.83% | 0.00 |
| 4 Mar 2026 | 0.83% | 0.00 |
| 3 Mar 2026 | 0.83% | 0.00 |
| 2 Mar 2026 | 0.83% | 0.00 |
| 27 Feb 2026 | 0.83% | 0.00 |
| 26 Feb 2026 | 0.83% | 0.00 |
| 25 Feb 2026 | 0.83% | 0.00 |
| 24 Feb 2026 | 0.83% | 0.00 |
| 23 Feb 2026 | 0.83% | 0.00 |
| 20 Feb 2026 | 0.83% | 0.00 |
| 19 Feb 2026 | 0.83% | 0.00 |
| 18 Feb 2026 | 0.83% | 0.00 |
| 17 Feb 2026 | 0.83% | 0.00 |
| 16 Feb 2026 | 0.83% | 0.00 |
| 13 Feb 2026 | 0.83% | 0.00 |
| 12 Feb 2026 | 0.83% | 0.00 |
| 11 Feb 2026 | 0.83% | 0.00 |
| 10 Feb 2026 | 0.83% | 0.00 |
| 9 Feb 2026 | 0.83% | 0.00 |
| 6 Feb 2026 | 0.83% | 0.00 |
| 5 Feb 2026 | 0.83% | 0.00 |
| 4 Feb 2026 | 0.83% | 0.00 |
| 3 Feb 2026 | 0.83% | 0.00 |
| 2 Feb 2026 | 0.83% | 0.00 |
| 30 Jan 2026 | 0.83% | 0.00 |
| 29 Jan 2026 | 0.83% | 0.00 |
| 28 Jan 2026 | 0.83% | 0.00 |
| 27 Jan 2026 | 0.83% | 0.00 |
| 26 Jan 2026 | 0.83% | 0.00 |
| 23 Jan 2026 | 0.83% | 0.00 |
| 22 Jan 2026 | 0.83% | 0.00 |
| 21 Jan 2026 | 0.83% | 0.00 |
| 20 Jan 2026 | 0.83% | 0.00 |
| 19 Jan 2026 | 0.83% | 0.00 |
| 16 Jan 2026 | 0.83% | 0.00 |
| 15 Jan 2026 | 0.83% | 0.00 |
| 14 Jan 2026 | 0.83% | 0.00 |
| 13 Jan 2026 | 0.83% | – |
Newest first. Scroll inside the table for earlier dates, back to 13 Jan 2026.
About this data
- ISIN
- SE0003613090
- Regulator
- Finansinspektionen (Sweden)
- First seen in dataset
- 13 Jan 2026
We show regulatory short-position data only: no prices, no valuations, no recommendations.
Frequently asked questions
- How shorted is Moberg Pharma AB (publ) right now?
- Disclosed net short positions total 0.83% of Moberg Pharma AB (publ)'s share capital as of 12 Oct 2026, per the Finansinspektionen's public register. That makes it the 66th most shorted Swedish stock, out of 101 companies with disclosed positions.
- Who is shorting Moberg Pharma AB (publ)?
- The Finansinspektionen names each holder of a position of 0.5% or more. Currently disclosed: CITADEL ADVISORS II LLC.
- What is Moberg Pharma AB (publ)'s short interest?
- 0.83% of share capital as of 12 Oct 2026. "Short interest" is the US term; the Finansinspektionen publishes each disclosed net short position of 0.5% or more by name, summed here, so it is a lower bound on all short selling in the stock.
- What does this number include?
- The sum of individually disclosed net short positions of 0.5% or more of share capital. Positions between 0.1% and 0.5% are reported to the regulator privately and are not public, so the true total can be higher.
- How often is this updated?
- Position holders must disclose changes by the next trading day; we refresh from the Finansinspektionen's register every trading day.