How shorted is Hillman Solutions Corp.? HLMN
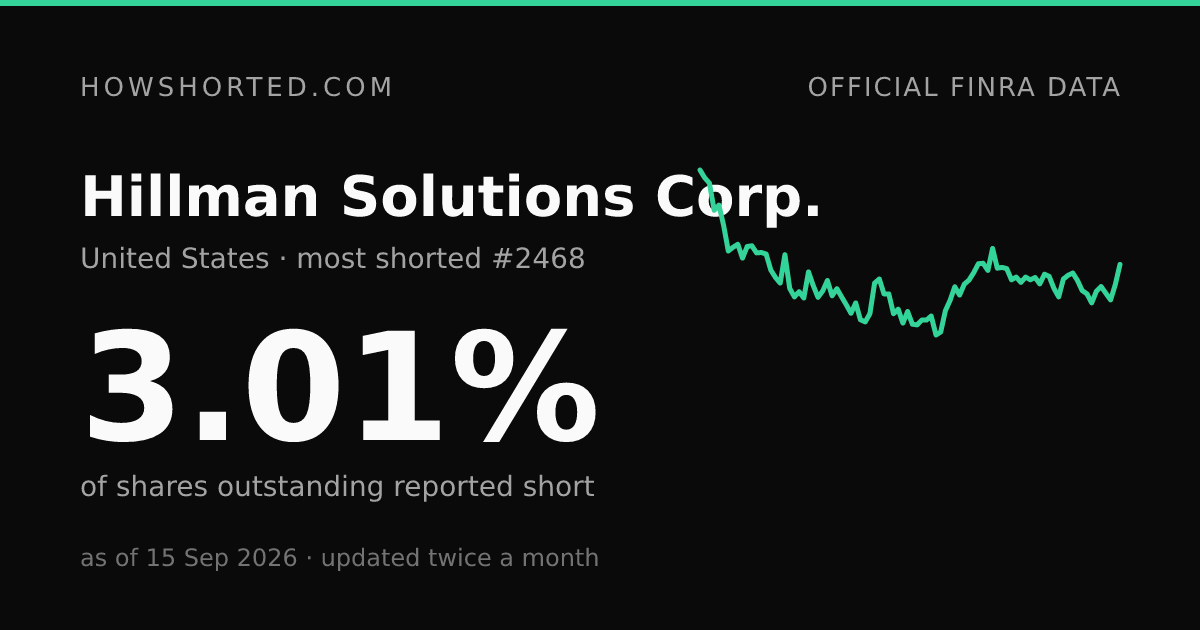
#2,468most shorted US stockof 3,805 ranked stocks, more shorted than 35%
- vs previous report
- +0.54
- 5 reports (~10 weeks)
- +0.72
- days to cover
- 2.58
Markers along the chart's base: ▲ results announced (an 8-K reporting results was filed) ▲ quarterly or annual report filed. Dates are SEC filing dates; hover a point to see events since the previous settlement.
Days to cover
FINRA's own figure: reported shares short divided by the stock's average daily trading volume, published alongside each settlement. It expresses the short position in days of typical trading rather than as a percentage of the company; the two can move differently.
Short interest around results
For each results announcement (an 8-K reporting results, by its SEC filing date), the FINRA settlement before it and the first one after. Settlements fall twice a month, so the two figures can sit up to a month apart and much else changes in between: this shows what was reported, not why.
| Results filed | Settlement before | Settlement after | Change |
|---|---|---|---|
| 4 Aug 2026 | 2.24% 31 Jul 2026 | 2.06% 14 Aug 2026 | −0.18 |
| 13 Jul 2026 | 2.29% 30 Jun 2026 | 2.42% 15 Jul 2026 | +0.13 |
| 27 Apr 2026 | 2.78% 15 Apr 2026 | 2.58% 30 Apr 2026 | −0.20 |
| 17 Feb 2026 | 2.37% 13 Feb 2026 | 2.14% 27 Feb 2026 | −0.23 |
| 4 Nov 2025 | 2.53% 31 Oct 2025 | 2.67% 14 Nov 2025 | +0.14 |
| 5 Aug 2025 | 3.44% 31 Jul 2025 | 2.91% 15 Aug 2025 | −0.53 |
| 29 Apr 2025 | 2.19% 15 Apr 2025 | 2.48% 30 Apr 2025 | +0.29 |
| 18 Feb 2025 | 1.20% 14 Feb 2025 | 1.77% 28 Feb 2025 | +0.57 |
Fails to deliver
The SEC's fails-to-deliver figure for HLMN: the aggregate net balance of shares that failed to be delivered at each settlement date, published by the SEC twice a month and shown here verbatim for the trailing window. A balance is not a daily flow, and a fail has many ordinary causes; the SEC says it cannot guarantee the accuracy of the data. See what fails to deliver are and the largest balances today.
- Latest balance
- 581
- 14 Sep 2026
- Highest in window
- 74,277
- 8 Jul 2026
- Days with a balance
- 56
- Window
- 16 Sep 2025 to 14 Sep 2026
Source: U.S. Securities and Exchange Commission, fails-to-deliver data (public domain). Only settlement days with a positive balance appear; the largest balance in the window was 74K shares.
Embed this chart
Paste this snippet to embed the interactive chart. It updates with each FINRA report and keeps the source attribution. Preview
Cite this page
Sector: Industrials
History
| Settlement date | Short % | Change |
|---|---|---|
| 15 Sep 2026 | 3.01% | +0.54 |
| 31 Aug 2026 | 2.47% | +0.41 |
| 14 Aug 2026 | 2.06% | −0.18 |
| 31 Jul 2026 | 2.24% | −0.18 |
| 15 Jul 2026 | 2.42% | +0.13 |
| 30 Jun 2026 | 2.29% | +0.31 |
| 15 Jun 2026 | 1.98% | −0.24 |
| 29 May 2026 | 2.22% | −0.09 |
| 15 May 2026 | 2.31% | −0.27 |
| 30 Apr 2026 | 2.58% | −0.20 |
| 15 Apr 2026 | 2.78% | +0.06 |
| 31 Mar 2026 | 2.72% | +0.10 |
| 13 Mar 2026 | 2.62% | +0.48 |
| 27 Feb 2026 | 2.14% | −0.23 |
| 13 Feb 2026 | 2.37% | −0.32 |
| 30 Jan 2026 | 2.69% | −0.06 |
| 15 Jan 2026 | 2.75% | +0.26 |
| 31 Dec 2025 | 2.49% | −0.17 |
| 15 Dec 2025 | 2.66% | +0.06 |
| 28 Nov 2025 | 2.60% | −0.07 |
| 14 Nov 2025 | 2.67% | +0.14 |
| 31 Oct 2025 | 2.53% | −0.14 |
| 15 Oct 2025 | 2.67% | +0.07 |
| 30 Sep 2025 | 2.60% | −0.30 |
| 15 Sep 2025 | 2.90% | −0.03 |
| 29 Aug 2025 | 2.93% | +0.02 |
| 15 Aug 2025 | 2.91% | −0.53 |
| 31 Jul 2025 | 3.44% | +0.59 |
| 15 Jul 2025 | 2.85% | −0.19 |
| 30 Jun 2025 | 3.04% | +0.01 |
| 13 Jun 2025 | 3.03% | +0.24 |
| 30 May 2025 | 2.79% | +0.20 |
| 15 May 2025 | 2.59% | +0.11 |
| 30 Apr 2025 | 2.48% | +0.29 |
| 15 Apr 2025 | 2.19% | −0.22 |
| 31 Mar 2025 | 2.41% | +0.36 |
| 14 Mar 2025 | 2.05% | +0.28 |
| 28 Feb 2025 | 1.77% | +0.57 |
| 14 Feb 2025 | 1.20% | +0.08 |
| 31 Jan 2025 | 1.12% | −0.51 |
| 15 Jan 2025 | 1.63% | +0.11 |
| 31 Dec 2024 | 1.52% | 0.00 |
| 13 Dec 2024 | 1.52% | +0.13 |
| 29 Nov 2024 | 1.39% | −0.02 |
| 15 Nov 2024 | 1.41% | −0.34 |
| 31 Oct 2024 | 1.75% | +0.31 |
| 15 Oct 2024 | 1.44% | −0.37 |
| 30 Sep 2024 | 1.81% | +0.12 |
| 13 Sep 2024 | 1.69% | −0.53 |
| 30 Aug 2024 | 2.22% | 0.00 |
| 15 Aug 2024 | 2.22% | −0.40 |
| 31 Jul 2024 | 2.62% | +0.11 |
| 15 Jul 2024 | 2.51% | +0.82 |
| 28 Jun 2024 | 1.69% | +0.22 |
| 14 Jun 2024 | 1.47% | −0.06 |
| 31 May 2024 | 1.53% | −0.45 |
| 15 May 2024 | 1.98% | +0.28 |
| 30 Apr 2024 | 1.70% | −0.23 |
| 15 Apr 2024 | 1.93% | −0.21 |
| 28 Mar 2024 | 2.14% | −0.22 |
| 15 Mar 2024 | 2.36% | +0.19 |
| 29 Feb 2024 | 2.17% | −0.41 |
| 15 Feb 2024 | 2.58% | +0.28 |
| 31 Jan 2024 | 2.30% | +0.17 |
| 12 Jan 2024 | 2.13% | −0.31 |
| 29 Dec 2023 | 2.44% | −0.37 |
| 15 Dec 2023 | 2.81% | +0.70 |
| 30 Nov 2023 | 2.11% | −0.17 |
| 15 Nov 2023 | 2.28% | +0.14 |
| 31 Oct 2023 | 2.14% | −0.23 |
| 13 Oct 2023 | 2.37% | −0.90 |
| 29 Sep 2023 | 3.27% | +0.76 |
| 15 Sep 2023 | 2.51% | −0.15 |
| 31 Aug 2023 | 2.66% | −0.20 |
| 15 Aug 2023 | 2.86% | −0.43 |
| 31 Jul 2023 | 3.29% | −0.04 |
| 14 Jul 2023 | 3.33% | +0.01 |
| 30 Jun 2023 | 3.32% | −0.19 |
| 15 Jun 2023 | 3.51% | +0.02 |
| 31 May 2023 | 3.49% | +0.31 |
| 15 May 2023 | 3.18% | −0.37 |
| 28 Apr 2023 | 3.55% | +0.08 |
| 14 Apr 2023 | 3.47% | +0.10 |
| 31 Mar 2023 | 3.37% | −0.69 |
| 15 Mar 2023 | 4.06% | −0.54 |
| 28 Feb 2023 | 4.60% | +0.14 |
| 15 Feb 2023 | 4.46% | −0.73 |
| 31 Jan 2023 | 5.19% | −0.14 |
| 13 Jan 2023 | 5.33% | −0.21 |
| 30 Dec 2022 | 5.54% | −0.09 |
| 15 Dec 2022 | 5.63% | −0.13 |
| 30 Nov 2022 | 5.76% | +0.58 |
| 15 Nov 2022 | 5.18% | −1.69 |
| 31 Oct 2022 | 6.87% | +0.91 |
| 14 Oct 2022 | 5.96% | −0.07 |
| 30 Sep 2022 | 6.03% | −0.19 |
| 15 Sep 2022 | 6.22% | −0.58 |
| 31 Aug 2022 | 6.80% | −0.01 |
| 15 Aug 2022 | 6.81% | +0.11 |
| 29 Jul 2022 | 6.70% | +0.09 |
| 15 Jul 2022 | 6.61% | +0.86 |
| 30 Jun 2022 | 5.75% | +0.97 |
| 15 Jun 2022 | 4.78% | +0.38 |
| 31 May 2022 | 4.40% | +0.95 |
| 13 May 2022 | 3.45% | +0.21 |
| 29 Apr 2022 | 3.24% | +0.68 |
| 14 Apr 2022 | 2.56% | +0.24 |
| 31 Mar 2022 | 2.32% | +0.51 |
| 15 Mar 2022 | 1.81% | +0.06 |
| 28 Feb 2022 | 1.75% | +0.16 |
| 15 Feb 2022 | 1.59% | +0.18 |
| 31 Jan 2022 | 1.41% | +0.05 |
| 14 Jan 2022 | 1.36% | −0.01 |
| 31 Dec 2021 | 1.37% | −0.51 |
| 15 Dec 2021 | 1.88% | −0.19 |
| 30 Nov 2021 | 2.07% | −0.80 |
| 15 Nov 2021 | 2.87% | −0.11 |
| 29 Oct 2021 | 2.98% | −0.33 |
| 15 Oct 2021 | 3.31% | – |
Newest first. Scroll inside the table for earlier dates, back to 15 Oct 2021.
Frequently asked questions
- How shorted is Hillman Solutions Corp. right now?
- 3.01% of Hillman Solutions Corp.'s (HLMN) shares outstanding were reported short for settlement date 15 Sep 2026, per FINRA's consolidated short interest report. That makes it the 2,468th most shorted US stock, out of 3,805 we rank.
- What does this number include?
- FINRA member firms must report their short positions in all US equities twice a month; FINRA consolidates them per security. We divide that official share count by the company's shares outstanding from its SEC filings. This is the regulatory figure, not a daily estimate.
- Why does it only update twice a month?
- US short interest is reported for settlement on the 15th and the last business day of each month, and FINRA publishes the consolidated figures about nine business days later. That cadence is set by regulation; no daily official figure exists.
- Is this HLMN's short float?
- No. This is short interest as a percentage of shares outstanding, the count in the company's SEC filings. "Short float" divides the same FINRA short count by the public float, which excludes closely held shares, so it comes out higher for the same company. We publish no float estimates: the float is not a regulatory figure.
- What is HLMN's days to cover?
- 2.58 days for settlement date 15 Sep 2026: FINRA's own short interest ratio, the reported shares short divided by average daily trading volume. It is published in the same FINRA file and shown verbatim; we hold no volume data ourselves.
- Which funds are short?
- US public short interest is aggregate-only: individual short sellers are not named. Only some EU markets publish named positions.