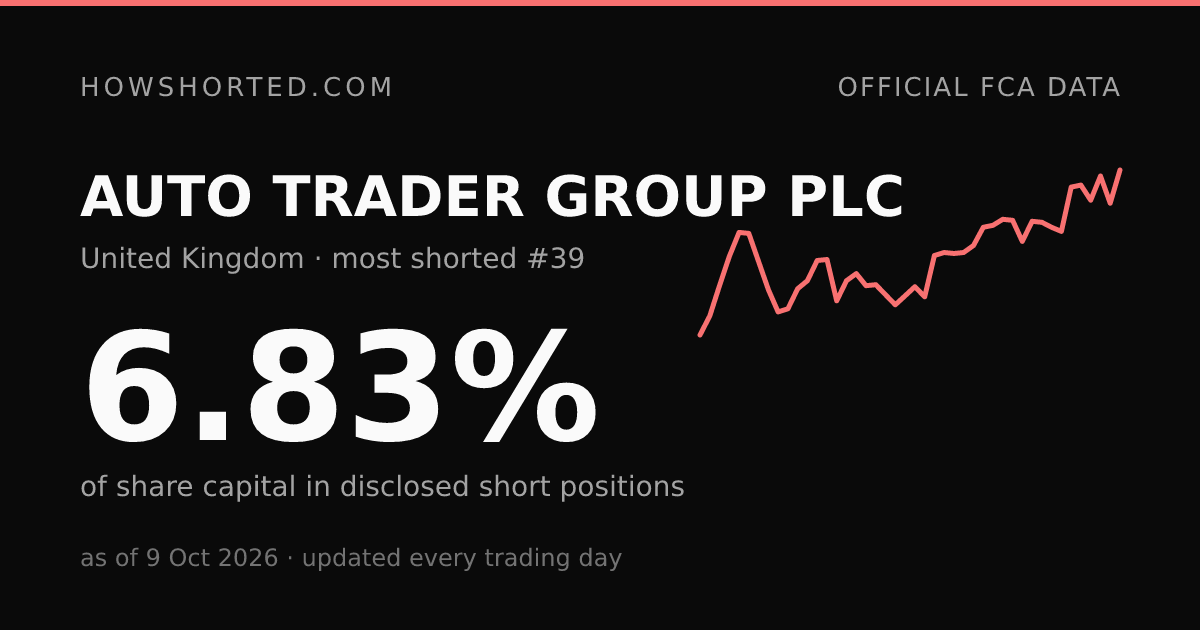
How shorted is AUTO TRADER GROUP PLC? GB00BVYVFW23
#39most shorted UK stockof 421 companies with disclosed positions, more shorted than 90%
- 5-day change
- +0.17
- 20-day change
- +1.26
Embed this chart
Paste this snippet to embed the interactive chart. It updates every trading day and keeps the source attribution. Preview
Or a small live badge (Markdown, works in READMEs):
Cite this page
Before 2026: the named era
Reconstructed from the frozen named register: the sum of individually disclosed positions of 0.5% or more in AUTO TRADER GROUP PLC at each disclosure date, back to 6 Apr 2016. This is a lower bound and a different measure from today's aggregate above, because positions between 0.1% and 0.5% were reported to the FCA but never published with names, so the two series are charted separately and are not comparable point for point. See the methodology.
Who was short AUTO TRADER GROUP PLC?
The FCA stopped naming position holders on 13 July 2026. This is the final named register's last word, every position of 0.5%+ still open as of 10 Jul 2026, from our frozen archive of 530 named AUTO TRADER GROUP PLC disclosures dating back to 2012. It no longer updates. Browse the full final register or see how UK disclosure changed.
| Position holder (historical) | Position | Disclosed |
|---|---|---|
| Kintbury Capital LLP | 1.87% | 7 Jul 2026 |
| Ilex Capital Partners (UK) LLP | 0.60% | 22 Jun 2026 |
| AHL Partners LLP | 0.59% | 6 Jul 2026 |
Sector: Technology
History
| Position date | Short % | Change |
|---|---|---|
| 9 Oct 2026 | 6.83% | +0.33 |
| 8 Oct 2026 | 6.50% | −0.27 |
| 7 Oct 2026 | 6.77% | +0.24 |
| 6 Oct 2026 | 6.53% | −0.15 |
| 5 Oct 2026 | 6.68% | +0.02 |
| 2 Oct 2026 | 6.66% | +0.44 |
| 1 Oct 2026 | 6.22% | −0.04 |
| 29 Sep 2026 | 6.26% | −0.05 |
| 28 Sep 2026 | 6.31% | −0.01 |
| 25 Sep 2026 | 6.32% | +0.20 |
| 24 Sep 2026 | 6.12% | −0.21 |
| 23 Sep 2026 | 6.33% | −0.01 |
| 22 Sep 2026 | 6.34% | +0.06 |
| 21 Sep 2026 | 6.28% | +0.02 |
| 18 Sep 2026 | 6.26% | +0.18 |
| 16 Sep 2026 | 6.08% | +0.07 |
| 14 Sep 2026 | 6.01% | +0.01 |
| 10 Sep 2026 | 6.00% | −0.01 |
| 9 Sep 2026 | 6.01% | +0.03 |
| 8 Sep 2026 | 5.98% | +0.41 |
| 7 Sep 2026 | 5.57% | −0.10 |
| 4 Sep 2026 | 5.67% | +0.09 |
| 28 Aug 2026 | 5.58% | +0.09 |
| 26 Aug 2026 | 5.49% | −0.10 |
| 25 Aug 2026 | 5.59% | −0.10 |
| 24 Aug 2026 | 5.69% | +0.01 |
| 18 Aug 2026 | 5.68% | −0.12 |
| 17 Aug 2026 | 5.80% | +0.07 |
| 13 Aug 2026 | 5.73% | +0.20 |
| 11 Aug 2026 | 5.53% | −0.41 |
| 10 Aug 2026 | 5.94% | +0.01 |
| 7 Aug 2026 | 5.93% | +0.20 |
| 6 Aug 2026 | 5.73% | +0.08 |
| 5 Aug 2026 | 5.65% | +0.20 |
| 3 Aug 2026 | 5.45% | +0.03 |
| 31 Jul 2026 | 5.42% | −0.22 |
| 29 Jul 2026 | 5.64% | −0.28 |
| 28 Jul 2026 | 5.92% | −0.28 |
| 27 Jul 2026 | 6.20% | −0.01 |
| 24 Jul 2026 | 6.21% | +0.24 |
| 22 Jul 2026 | 5.97% | +0.29 |
| 17 Jul 2026 | 5.68%ʳ | +0.30 |
| 16 Jul 2026 | 5.38% | +0.19 |
| 8 Jul 2026 | 5.19% | – |
Newest first. Scroll inside the table for earlier dates, back to 8 Jul 2026.
ʳ figure revised by the FCA after first publication. See how revisions work.
About this data
- ISIN
- GB00BVYVFW23
- Reportable Shares List
- On the FCA's RSL since 13 Jul 2026.
- First seen in dataset
- 8 Jul 2026
We show regulatory short-position data only: no prices, no valuations, no recommendations.
Frequently asked questions
- How shorted is AUTO TRADER GROUP PLC right now?
- 6.83% of AUTO TRADER GROUP PLC's issued share capital was sold short as of 9 Oct 2026, per the FCA's aggregate net short position publication. That makes it the 39th most shorted UK stock, out of 421 companies with disclosed positions.
- What is AUTO TRADER GROUP PLC's short interest?
- 6.83% of issued share capital as of 9 Oct 2026. "Short interest" is the US term; the FCA publishes the aggregate net short position, the sum of every disclosed position of 0.2% or more, so it is a lower bound on all short selling in the stock.
- What does this number include?
- It is the sum of every individual net short position amounting to 0.2% or more of the company's issued share capital, as notified to the FCA. Smaller positions are not counted, so total short interest can be somewhat higher.
- Which funds are shorting AUTO TRADER GROUP PLC?
- Since 13 July 2026 the FCA no longer publishes position-holder names, only the aggregate per company. The final named register (as of 10 Jul 2026) listed 3 funds with positions of 0.5% or more in AUTO TRADER GROUP PLC, led by Kintbury Capital LLP at 1.87%; the full final list is preserved on this page.
- How often is this updated?
- The FCA publishes every working day around midday, two working days after the position date. We ingest each publication the same day and re-check recent days for corrections.